Cyber Triage on MacOS?
I’ve been getting back into DFIR and I was testing out this tool called Cyber Triage. I discovered it when I saw a friend of mine had a workshop that he was doing and I duly registered for it. It’s a neat tool that helps an investigator through his examination process. It collects the usual data on a system like metadata, user activity and the places where malware tends to persist. It also collects volatile data. In addition to collection, tool also helps with prioritisation and recommendation. This means that it directs you to look at what it deems are higher priority items and then provides guidance on how to tackle them. I eagerly downloaded the tool, and suddenly remembered when I tried to install it that DFIR is still predominantly a Windows game. The tool needed to be installed on a Windows machine and of course, the collection tool as well would only work on a Windows machine. Not wanting to heap judgment on a tool based on what it cannot do, I optimistically dusted off my Microsoft Surface to install the tool on and collect data.
This is not a review of Cyber Triage. Cyber Triage has a lot of cool and interesting features that you should probably check out by yourself with an evaluation copy, but for me, I’m currently focusing on one objective. But let’s not get ahead of ourselves and let’s first colect some data from my Windows machine.

When you say you want to Triage the Local Host, you get this popup which to me makes sense.
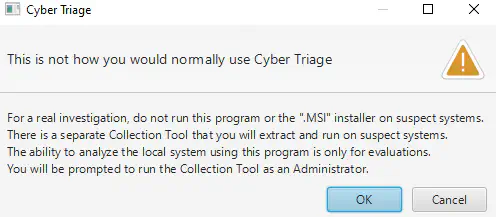
You probably should not be collecting artifats from a compromised system and should instead use the collection tool that they offer. So I did just that. Selecting other host, you will see the option to use the Collection Tool at the bottom bar of the window:

Selecting this option extracts a set of files (together make up the collection tool) that you can then copy on an external drive and use to collect artifacts from a system that you’re investigating.
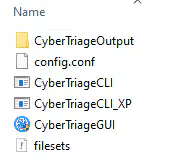
When you run the tool, you first configure it tell it to which level you want to collect artifacts and then run it. I ran it for both a VM and my Microsoft Surface and it generated two gzipped files in the output directory:

In the image above, the Surface file is the 2.7 GB gzipped file. It’s quite a hefty file and that is because it also includes all relevant files on the system. One thing you may also notice is that the file is a json file. I was elated when I saw this because it meant that I could immediately stop working on the Windows machine and move the analysis to a Linux or MacOS box where I feel more at home.
The first thing I did was to decompress the file to understand just what kind of beast I was dealing with. Uncompressed, the file came out to about 4.1Gb
-rw-r--r-- 1 sherangunasekera staff 4.1G Sep 20 22:45 cttout_DESKTOP-BCC5PAU_20230920_12_51_14.json
So already it’s going to be a challenge to open, let alone inspect a 4.1Gb json file. I tried opening it on my Mac Studio using Sublime Text, but that took too long. It’s quicker to open it on the terminal using less, but again, paging through screen after screen can get tedious. Then I thought, “Why not use jq?”. For the uninitiated, jq is a command line json file processor that can work on and extract data from a json file. The downside of jq is that you have to almost learn an entire language before you get going. But in reality, you can get up to speed fairly quickly. So in order to process my behemoth of a json file, all I had to do was to stream the gzip file using gzcat and then pipe it through to jq. Simple right? Let’s try that:
➜  sherangunasekera@Sherans-Mac-Studio ctlite git:(master) ✗ gzcat cttout_DESKTOP-BCC5PAU_20230920_12_51_14.json.gz | jq empty
jq: parse error: Invalid string: control characters from U+0000 through U+001F must be escaped at line 84413, column 94
Well shit. I should have expected the quirks that come with a Windows Mac/Linux operation. Just where and what is this invalid string with un-escaped control characters? I open up the uncompressed json file with
less and head on down to line 84413 to find:

Ah yes, there seem to be some weird characters when the tool collected the PE Headers of executable files. I didn’t actually bother trying to figure out what they are, because my current goal is to get the file to work with jq so that I can dig deeper into its format. So I started looking for ways in which I could fix these invalid control characters while streaming the file.
Either I was impatient and didn’t spend enough time on the problem, or the general consensus seems to be that a json file should NOT contain characters not allowed by the spec. If by chance you do happen to have a file that doesn’t conform to the spec, then you’re shit outta luck. I choose to believe the latter.
After browsing many Stack Overflow and blog posts and cajoling ChatGPT into giving me a one liner this one seemed to work:

But a minute and twelve seconds to run? Jeez! That seems unusually slow. To breakdown the command:
gzcat cttout_DESKTOP-BCC5PAU_20230920_12_51_14.json.gz | \
perl -C -pe 's/([^\x20-\x7E])/sprintf(" ")/ge' | jq empty
gzcat <filename>will “cat” or print the output to standard out after decompressing it. So think of it like you stream and decompress bytes to stdout without having to first decompress the file and then cat the contents. This helps to not use up your disk space.perl -C -pe 's/([^\x20-\x7E])/sprintf(" ")/ge'Will look at the stream and replace any character not in printable range (0x20 - 0x7E) with a space. Basically this will replace all invalid control chars with a space.jqempty will run the stream through jq but will not print anything out to stdout. This is a good way to validate any json files that you have. If it returns without an error, then your json file is valid, if not you’ve got an error.
I can technically run this and do my examination on the format of the file, but it will take me a minute and change each time I run it. I didn’t feel like that was productive so I thought I’d try to improve on the speed of processing the gzipped json file. In theory, I could have just stopped here and written that json file out to disk and worked on that, but I constrained myself to not working on the decompressed gzip file which was twice the size of the gzipped one. Also note that I am destructively fixing this file, meaning I am replacing each invalid control character with a space. In DFIR this is an obvious no-no because you really want to work with the original collected data as much as possible. There are probably better solutions on how to do this, but that is a post for another day. When I say “destructive” I am still not making any permanent changes to the collected data because I am only operating on the stream in memory.
I set out to write a go program to do what I needed to do. The journey was very long and took almost a month of me working on it over the weekends because I was obsessed. I am not going to post all the code I wrote, but will give you a break down of what and how things transpired:
Naive Go 🔗
I wrote a go program to read the gzipped contents, clean out invalid control characters and output it to a json file. I had to write a transformer using “golang.org/x/text/transform” to filter out the characters I didn’t want. It took a minute at 35 seconds to execute and extract the json file. I could then run jq on that file and work with that. That took about 30 seconds to execute per try which was not too bad, but it goes against my constraints for not having the decompressed json file lying around.

Using pgzip 🔗
It turns out that the encoding/gzip in the standard library is not as quick as it can be. So after hunting around I discovered pgzip. This is purpotedly a faster version of gzip which you can use as a drop in replacement. This was great because I didn’t have to change any of my code. This got me an entire 24 seconds shaved off which was quite impressive! But I felt I could do better.

By then, I also discovered gojq which is a pure go implementation of jq. This had me thinking that I could run all my analysis or extraction directly bundled into one go program. While writing all this code and looking deep into json processing, I discovered that using a transformer the way I did was extremely slow and wasteful. Having achieved some success with pgzip, I looked around to see if there was a faster json processor. It seemed like there were a few, and for my use case, I ended up selecting json-iter.
There was just one problem though. All json processors I looked at adhered very strongly to the spec that you cannot have certain control characters when reading a file. They would all throw errors with no way to adapt them into my program. So I ended up having to form and modify json-iter to adapt to my use case. Specifically, I changed some code in the iter_str.go file like this (line 14-19):
|
|
In the character check, if the character byte value is smaller than 0x20 then the original behaviour is to exit with an error. I changed that to not throw an error and instead to replace that character and the character in the buffer with 0x20 (which is a space). After making those changes, I went ahead and ran my program which used gojq, pgzip and json-iter. Basically the program behaves like gzcat and jq all rolled into one which also filters out invalid control characters:

24 seconds!!! I had dropped processing by 47 seconds! This was pretty much time to celebrate. I can basically probe this output file as much as I want by running various jq queries on it and only wait 24 seconds for it to return with results. This vastly speeds up my analysis of the file. Getting very excited about this, I decided to cross compile a version and run it on a Windows VM to see what kind of performance I can get on that:

Well that didn’t work. I ran out of memory. Back to the drawing board I guess. It would seem, after more inspection, that jq reads the entire decompressed data stream into memory before it executes.
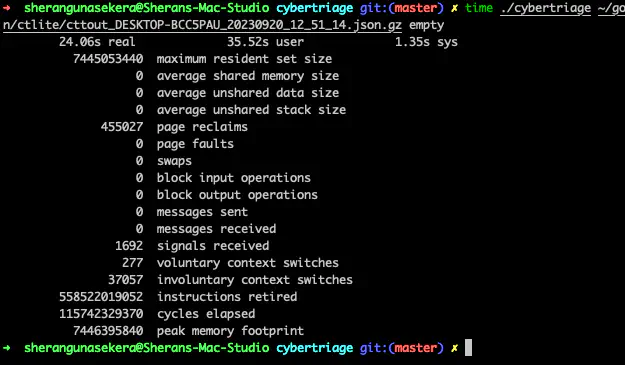
Look at that! 7446395840 bytes or 7.44Gb of maximum memory usage. This is why my lowly 4Gb RAM VM crapped out. So it appears that jq and also gojq do not operate on a stream by default. But they do have an option to by using the “—stream” option which then acts on the stream. The drawback to this is that you have to adapt your querying approach with jq. It isn’t a huge deal, but enough to be a pain in the ass.
I took some time in adapting my code to use gojq’s streaming because there are no examples of how to do this. You have to look through the source and figure things out. That was pretty much what I spent time doing and finally had my program running the way I wanted it to:
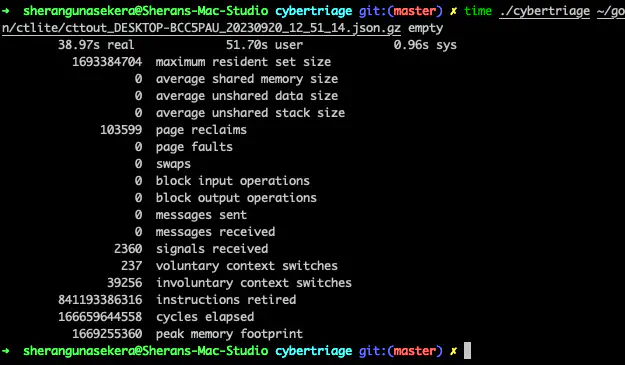
Takes a bit longer at 38 seconds but looking at the peak memory usage, it seems way better. Only 1.66Gb used. Let’s try running that on our Windows VM now:
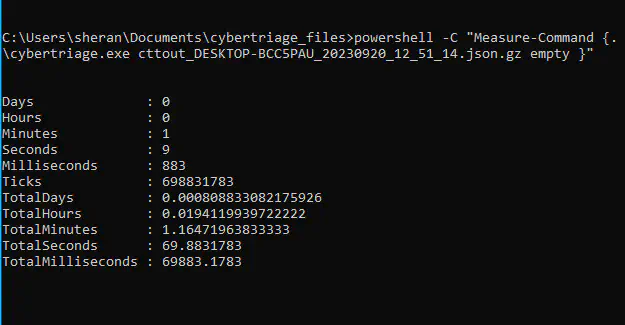
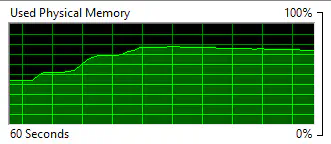
Not too bad for a very limited VM, I guess. At least I know it can also be used on Windows. I still have not found a way to log the maximum memory usage in Windows, but I did see it get to around 1.5 to 1.6Gb from the Resource Monitor. Here’s how it grew:
And with that we come to how to actually use the go program. Well, if using it with the jq stream queries, then to get all progress messages from Cyber Triage, you can run:
➜  sherangunasekera@Sherans-Mac-Studio cybertriage git:(master) ✗ ./cybertriage ~/go/src/github.com/sheran/ctlite/cybertriage_evaldata_20230822.json.gz \
"select(.[0][4] == \"progress\" and .[0][5] == \"message\")|select(.[1]|length > 0)|.[1]"
Creating temporary working folder
Opening target image/disk
Enumerating Files... (Step 1 of 13)
Collecting Network Caches... (Step 2 of 13)
Collecting DNS Cache.
DNS Cache collection started.
Collecting ARP cache.
Analyzing routing tables.
Searching for system registry files
Searching for system registry files
Searching for system registry files
Collecting Users... (Step 3 of 13)
Searching for user registry files
Searching for user registry files
Searching for user registry files
Analyzing Startup Items... (Step 4 of 13)
Analyzing Programs Run... (Step 5 of 13)
Collecting Network Shares... (Step 6 of 13)
Collecting System Configuration... (Step 7 of 13)
Analyzing Scheduled Tasks ... (Step 8 of 13)
Searching for scheduled task files
Searching for scheduled task files
Searching for scheduled task files
Searching for event logs
Searching for event logs
Searching for event logs
Analyzing Event Logs... (Step 9 of 13)
Analyzing event logs...
Parsing security log started.
Parsing security log completed.
Parsing microsoft-windows-terminalservices-localsessionmanager/operational log started.
Parsing microsoft-windows-terminalservices-localsessionmanager/operational log started.
Parsing Microsoft-Windows-TerminalServices-RDPClient/Operational log started.
Parsing Microsoft-Windows-TerminalServices-RDPClient/Operational log started.
Analyzing Application & Service event logs...
Collecting Processes... (Step 10 of 13)
Collecting Network Connections and Ports... (Step 11 of 13)
Collecting WMI database files
Collecting Powershell profile startup items
Processing startup folders
Searching for startup files
Searching for startup files
Searching for startup files
Analyzing startup folder: /ProgramData/Microsoft/Windows/Start Menu/Programs/Startup
Processing Prefetch files
Searching for Prefetch files
Searching for Prefetch files
Searching for Prefetch files
Searching for StartupInfo files
Searching for StartupInfo files
Searching for StartupInfo files
Collecting Web Files ... (Step 12 of 13)
Collecting Firefox Databases
Collecting Chrome Databases
Collecting Downloads
Collecting Internet Explorer files
Collecting Microsoft Edge files
End of scenario data
Additional data
Analyzing All Files... (Step 13 of 13)
That is an example I ran on the Cyber Triage evaluation data that they provided.
With this approach, it becomes quite easy to understand the Cyber Triage collection format and thereby continue your investigation on Linux or MacOS on the command line.
This post is kinda long, so I’m going to wrap it up here. I ended up talking more about how to effectively work with a roughly 4Gb, gzipped json file within memory and time constraints than about Forensics. Of course this tool is also applicable to non forensics use cases, though I wonder which other tech discipline will require cleaning out gargantuan json files.
Even as I wrap up this chapter, I have already written a similar cleaner in Zig and have seen some very promising results. Stay tuned I guess and maybe I’ll talk about that in the future.